

This screen displays the battery voltage and current in real time. The time evolution of these parameters is drawn on a graph. The screen has two display modes: driving and charging. The switch between modes is automatic depending on the charge situation.
Driving mode
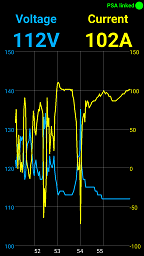
The vertical scales depends on the car profile selected in the settings menu and are adapted to the most common value range met in driving conditions. If a voltage value is out of range, the scale will be resized in order to show this value.
The current sign convention is as follows:
- Positive value: the current is drawn out of the battery
- Negative value: the current is supplied to the battery (Regeneration mode)
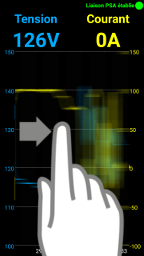
The graph window shows the last five minutes. It is possible to scroll horizontally the graph to see the previous values. If the graph has not been scrolled during 10 seconds, it will be automatically refocused on the last value.
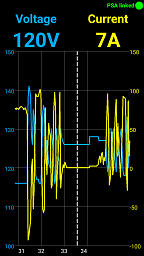
If the monitoring is stopped for more than one minute, the next monitoring will continue on the same graph but the gap between the two monitoring periods will be reduced to one minute. A grey dashed line will separate the two periods.
If a charge occurs during the stop and if the energy gauge is increased by more than 10%, the graph is cleared.
Charge mode
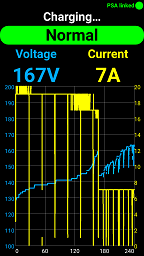
During a charge, the monitoring screen changes to charge mode. This mode has the same features as the driving mode plus a coloured label indicating the type of charge being performed.
The voltage and current scale are adapted to the most common value range met during charge.
When the charge is running, the screen title indicates “Charging…”. When the charge stops, the title indicates “Charge stopped”. In this case the monitoring screen remains in charge mode so the graph is still accessible. To retrieve the driving mode, just quit the monitoring screen and come back again to it.
Reviews
 Great App. V3.0, changing ECU parameter is an extraordinary feature. But be careful some parameters are tricky.
 не подключается
Super App, funktioniert richtig gut. Manchmal noch Verbindungsabbrüche, ansonsten ohne Probleme. Nur die deutsche Übersetzung ist manchmal etwas lustig.
Mainio ohjelma Peugeot 106 autoni monitorointiin ja hallintaan. PeraL on tehnyt asiantuntijana hienon lokalisaation.
Perfect solution for maintenance of 1gen PSA vehicles.